Insights
Mesirow Currency Management | 1Q2025 Commentary
Share this article
US dollar depreciates in 1Q2025
US dollar weakness continued into the end of the quarter, marking three consecutive months of dollar depreciation to start the year with tariff uncertainty abound. Recession fears weighed heavily on USD in early March as the Atlanta Fed's GDPnow model significantly revised its Q1 GDP forecast down to -1.5% annualized from over 2% previously. Tariffs were imposed on Canada and Mexico, although quickly removed for all USMCA compliant goods. With Europe proposing a major defense and infrastructure package, the Euro climbed higher, reflected by relative weakness for the dollar.
Non-farm payrolls surprised a bit lower at 151K vs. 160K consensus, with inflation also printing softer with core CPI at 0.2% vs. 0.3% expected. Tariff uncertainty continued as the US imposed 25% tariffs on steel and aluminum. The Fed kept rates unchanged and maintained its dot plot at 2 cuts for 2025, while revising its projections for GDP down and core PCE up.
FIGURE 1: DXY – 1Q2025
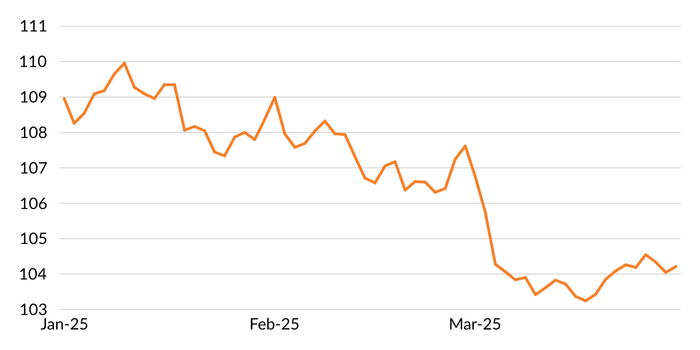
Figure 1 shows a line chart of the US dollar index falling or depreciating between the periods of January 2025 and March 2025.
Source: Bloomberg
EUR | Euro performed solidly over the quarter, landing in the upper half of the G10 in Q1. The common currency was buoyed by the proposed major defense and infrastructure package in March, heavily influenced by Germany. The ECB cut rates by 50bps in the quarter to 2.5%, marking six consecutive cuts while signaling that the end of the easing cycle was near. Data prints disappointed as German factory orders dropped -7% vs. -2.5% expected in January with wage growth falling to 4.1% in Q4 2024 from 4.5% previously, while inflation releases towards the end of the quarter were softer for France and Germany. Tariff uncertainty as well as failed Trump-Putin talks kept Euro more contained towards quarter-end.
GBP | Sterling performed relatively well in Q1, landing just into the upper half of the G10, buoyed by a weaker US dollar and positive data releases to end the quarter. Additionally, Germany's proposed defense and infrastructure package lifted European bond yields higher broadly, including in the UK. While GDP and industrial production data surprised lower, the labor market surprised higher with employment registering at 144K vs. 91K expected. After cutting rates earlier in the quarter, the BoE kept rates on hold at 4.5% In March while noting both inflationary and tariff-related concerns. Towards quarter-end, headline inflation printed slightly lower than expected at 0.4% MoM vs. 0.5% consensus while retail sales exceeded consensus at 1.0% MoM vs. -0.5% expected.
JPY | Yen was a strong performer over the quarter, landing in the upper third of the G10 in Q1. The BoJ delivered a rate hike in January of 25bps, bringing rates up to 0.5%, the highest since 2008. While the central bank left the door open for more hikes, rates were subsequently left unchanged with Governor Ueda stating that wages and prices are on track while also indicating the difficulty in ascertaining progress “when uncertainties over the US and overseas trade policies are high.” Inflation printed lighter than expected later in the quarter, with national CPI registering at 3.5% MoM vs. 3.7% consensus.
CAD | Canadian dollar was the worst performer in the G10 over the quarter as a direct target of Trump’s tariff policy. CAD whipsawed as Trump’s tariff announcements were unpredictable – previously delayed 25% tariffs were imposed, USMCA compliant goods were then removed, Canada announced retaliatory tariffs, steel and aluminum tariffs were announced, followed by more retaliatory tariffs from Canada. Inflation printed softer at 2.2% YoY vs. 2.6% expected. Mark Carney won the vote to replace Justin Trudeau as prime minister on a strong stance on trade policy. The BoC cut rates twice to 2.75% to help Canadians manage the uncertainty related to tariffs.
AUD | Australian dollar landed in the lower third of the G10 in Q1 as risk sentiment fell into quarter-end. The RBA delivered an expected 25bps cut in rates. Although positive developments with key trading partners, Europe and China, helped support AUD later in the quarter, Australian dollar was pressured as the US imposed tariffs on steel and aluminum, followed by falling data prints in March – employment -52.8K vs. +30K expected, inflation 2.4% YoY vs. 2.5% expected. Risk sentiment fell with the tariff-related uncertainty.
CHF | Swiss franc landed in the middle of the G10 in Q1, with an SNB rate cut offsetting safe-haven flows. Despite a rise in inflation of 0.3% MoM vs. 0.2% expected, the SNB cut rates in March by 25bps to 0.25%, citing global economic uncertainty as the reason for easing. SNB president Schlegel stated that “this rate cut has an expansionary impact,” and that “the probability of additional policy easing is naturally lower.” Safe-haven attractiveness helped support Swiss franc into quarter-end on the back of tariff-related uncertainty.
EM | Emerging market currencies climbed 1.74% in Q1, as represented by the MSCI Emerging Markets Currency Index, as US dollar weakness helped promote higher EM currencies. Mexico and China were prime targets of Trump’s tariff policies, as China was hit with an additional 10% tariff on its exports to the US. While Mexico was threatened with 25% tariffs, President Sheinbaum and President Trump came to an agreement to delay tariffs for goods and services that fell under the North American trade agreement. Tariff uncertainty bumped EM currency volatility higher as the quarter unfolded.
TABLE 1: USD-BASED AS OF March 31, 2025
| FX Rate | Change 3M % | Change 1Y% | ||
| EUR-USD | 1.0802 | 4.32% | 0.02% | |
| GBP-USD | 1.29075 | 3.06% | 2.18% | |
| USD-JPY | 149.54 | 5.10% | 1.21% | |
| AUD-USD | 0.62315 | 0.65% | -4.48% | |
| USD-CAD | 1.43925 | -0.07% | -5.98% | |
| USD-CHF | 0.88475 | 2.43% | -1.80% | |
| Source: WM/Reuters | ||||
Currency for return
Currency Alpha
Mesirow Currency Management’s (MCM) Extended Markets Currency Alpha, Asian Markets Currency Alpha, Emerging Markets Currency Alpha and Systematic Macro strategy all suffered losses this quarter.
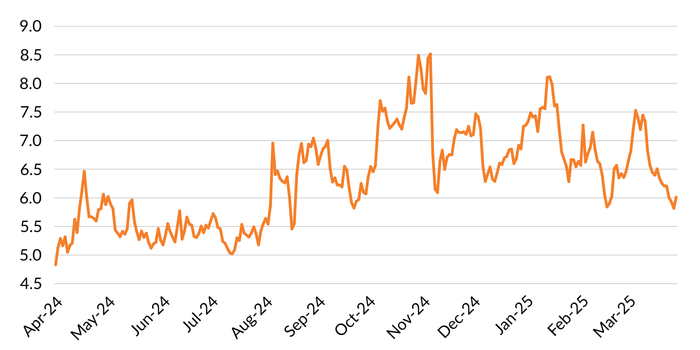
Our Machine Learning model performed the best over the quarter, but, unfortunately, our trend following suite of models and Economic Surprise model negated any gains made. Global volatility fell during the first half of Q1 (Figure 2) after ending 2024 at increased levels (Figure 3).
FIGURE 2: MCM'S GLOBAL VOLATILITY INDICATOR1: JANUARY 2025 – MARCH 31, 2025
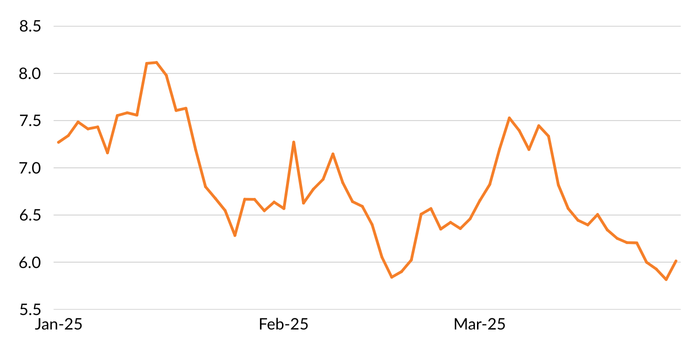
Figure 2 shows a line chart of MCM's Global Volatility Indicator between January 2025 and March 2025. The GVI’s high was on January 15 and its low on February 18.
Source: Mesirow
FIGURE 3 : MCM'S GLOBAL VOLATILITY INDICATOR2: APRIL 2024 – MARCH 31, 2025
Source: Mesirow
The strategy’s best performers were our short US dollar positions against the Indian rupee and the Colombian Peso (Figure 4) while our worst performers were our long US dollar positions against the Philippine peso and the Taiwan new dollar (Figure 5).
FIGURE 4 : TOP 5 PERFORMERS: JANUARY – MARCH 31, 2025
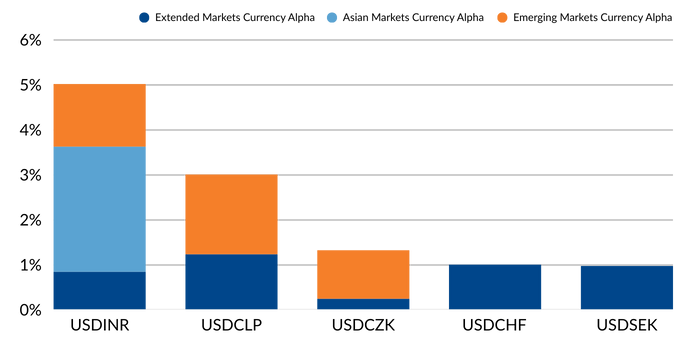
Figure 4 shows the top 5 performing currency pairs for 1Q2025: USDINR, USDCLP, USDCZK, USDCHF, USDSEK.
FIGURE 5 : BOTTOM 5 PERFORMERS: JANUARY – MARCH 31, 2025
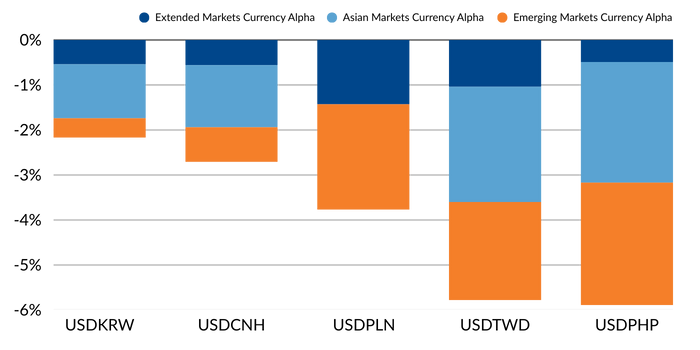
Figure 5 shows the worst 5 performing currency pairs for 1Q2025: USDKRW, USDCNH, USDPLN, USDTWD, USDPHP.
Intelligent Multi-Strategy Currency Factor
MCM’s Intelligent Multi-Strategy Currency Factor gave back -0.42% (gross) of value in the first quarter, as a weaker US dollar went against primarily long USD positioning. Although NOK and JPY positioning were productive, short CHF and SEK positions against USD were especially penal over the last two months of the quarter. While Value provided significant added value, both Momentum and Carry detracted from the portfolio, ultimately leading to an underperforming quarter.
Latest MCM Viewpoints
- Don’t let FX erode your gains: Embedded currency exposure in a portfolio can detract from risk-adjusted returns. Investors should assess how currency exposure impacts their portfolios and consider strategies to manage this risk as a means of enhancing overall portfolio outcomes.
- Four strategies to reduce liquidity management stress: Identifying the appropriate liquidity management approach for a currency overlay is an important risk consideration not to overlook.
- Safe haven currency hedging: Why do US and Swiss pension funds use different currency risk strategies?
Contact us
To learn more about Mesirow Currency Management’s custom currency solutions, please contact Joe Hoffman, CEO Currency Management at joseph.hoffman@mesirow.com.
Explore currency solutions
Passive and Dynamic Risk Management
Customized solutions to manage unrewarded currency risk in international portfolios.
Currency for Return
Strategies that aim to profit from short and medium-term moves in the currency market.
Fiduciary FX
Trading solution for asset managers and owners with focus on reducing transaction costs, improving transparency and enhancing efficiency.
1., 2. The GVI is an internal proprietary model utilizing one month at-the-money (ATM) volatility for G10 currencies, including crosses plus BIS liquidity report weightings.
Spark
Our quarterly email featuring insights on markets, sectors and investing in what matters