Insights
Don’t let FX erode your gains
Share this article
US investors' exposure to non-US assets has grown, but their approach to managing currency risk has not kept pace and remains outdated and often unmanaged.
Historically, US investors have exhibited a strong home bias, allocating the majority of their investments to USD-denominated assets. Consequently, currency risk within their portfolios was often overlooked. Over the past 20+ years, though, this home bias has diminished significantly and exposure to non-US assets has grown.
According to a study by the Center for Retirement Research at Boston College, non-US stocks have increased from approximately 20% of pension funds’ traditional equity holdings in 2000 to nearly 40% in 2023. This figure doesn’t account for the additional growth in non-US exposure stemming from other asset classes, such as private equity, real estate, and infrastructure. It is widely recognized that embedded currency exposure in a portfolio introduces an uncompensated and unnecessary risk, which can detract from risk-adjusted returns over the long term. Investors should assess how currency exposure impacts their portfolios and consider strategies to manage this risk as a means of enhancing overall portfolio outcomes.
Risk and Return
Table 1 below illustrates the risk and return metrics for the MSCI EAFE Index, comparing unhedged and hedged portfolios. Across all time periods, the annualized risk of the hedged portfolio was consistently lower than that of the unhedged portfolio. Moreover, the annualized returns of the hedged portfolio were higher, leading to improved risk-adjusted returns for investors who chose to hedge their currency risk.
TABLE 1 – MSCI EAFE RISK AND RETURN1
| Annualized returns | Annualized volatility | |||||
| Time period | MSCI EAFE unhedged2 | MSCI EAFE USD hedged | MSCI USA3 | MSCI EAFE unhedged | MSCI EAFE USD hedged | MSCI USA |
| 3 years | 4.15% | 10.68% | 10.45% | 17.01% | 11.44% | 17.62% |
| 5 years | 5.89% | 10.05% | 15.28% | 17.84% | 13.66% | 18.47% |
| 10 years | 5.07% | 8.78% | 12.74% | 15.26% | 12.48% | 15.54% |
| 20 years | 5.16% | 7.64% | 10.12% | 16.74% | 13.45% | 15.13% |
Source: Bloomberg | 1. Time period ending 30 Nov 2024. | 2. The MSCI EAFE Index is a stock market index that is designed to measure the equity market performance of developed markets outside of the US & Canada. | 3. The MSCI USA Index is designed to measure the performance of the large and mid cap segments of the US market.
Next, we analyzed the rolling 3-year returns of hedged and unhedged portfolios, as shown in Chart 1. Since 2002, the hedged portfolio consistently delivered returns that were equal to or superior to those of the unhedged portfolio.
CHART 1 – ROLLING 3-YEAR RETURNS
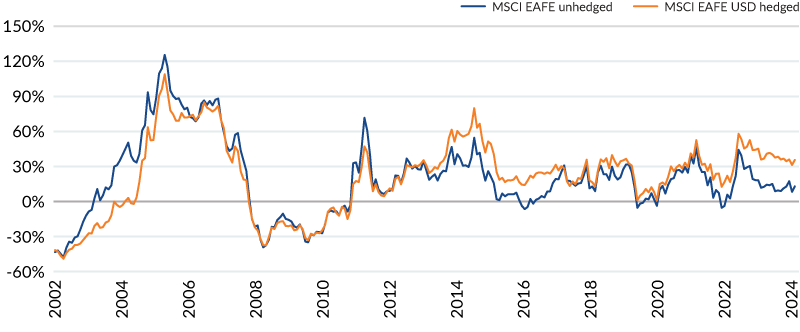
Chart 1 shows the rolling 3-year returns of a hedged v. unhedged portfolio from 2002 - 2024. The hedged portfolio shows returns that were equal to or superior to those of the unhedged portfolio.
Source: Bloomberg
In Chart 2, we present the rolling annualized risk of both hedged and unhedged portfolios. In almost all cases, the hedged portfolio exhibited lower annualized risk. Additionally, the risk attributable solely to currency remained relatively stable over the past 20 years, ranging from just under 5% per annum to approximately 10% per annum.
CHART 2 – ROLLING ANNUALIZED RISK
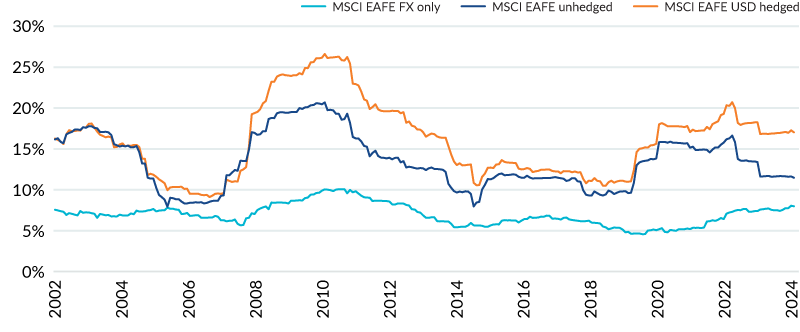 Chart 2 shows the rolling annualized risk of a hedged v unhedged portfolio. The hedged portfolio shows lower annualized risk than the unhedged portfolio.
Source: Bloomberg
Currency impact
Investors have traditionally allocated to non-US assets for several key reasons, including diversification, growth opportunities, and risk management. The return profile of these investments comprises two components: the return of the underlying asset and the impact of currency fluctuations relative to the US dollar.
In recent years, unhedged non-US equities have underperformed compared to the US equity market, largely due to the strength of the US dollar against other currencies. However, investors who hedged their currency exposure achieved returns comparable to US equities over the past three years (see Table 1 above) and significantly better long-term returns than unhedged non-US equities, with reduced overall risk.
Notably, the risk-to-return ratio of the unhedged EAFE benchmark is more than 50% lower than that of the hedged benchmark across all time periods. The unhedged portfolio’s risk-to-return ratio is even worse when compared to the MSCI USA index. In contrast, the hedged EAFE portfolio’s risk-to-return ratio was higher than the MSCI USA index over the three-year period and about 10% lower in other periods.
Table 2 illustrates these findings, underscoring the substantial impact of currency movements on investment performance. This highlights the importance of considering currency hedging strategies when investing in non-US assets.
TABLE 2 – RISK-TO-RETURN RATIOS
| Time period | MSCI EAFE unhedged | MSCI EAFE USD hedged | MSCI USA |
| 3 years | 0.24 | 0.93 | 0.59 |
| 5 years | 0.33 | 0.74 | 0.83 |
| 10 years | 0.33 | 0.70 | 0.82 |
| 20 years | 0.31 | 0.57 | 0.67 |
Source: Bloomberg
Hedging assumptions
Other reasons US investors have historically avoided hedging currency risk, aside from their home bias, include:
- The belief that currencies tend to mean-revert over the long term;
- The perception of diversification benefits; and
- Concerns about hedging costs.
However, these assumptions warrant closer examination.
As noted earlier in this paper, the home bias among US investors has declined significantly in recent years. Even if currencies do mean-revert over time, this process occurs over extended periods and introduces significant risk to portfolios. Furthermore, although currencies are often cited as providing diversification benefits, this theory does not hold up during periods of market stress.
In such times, investors tend to flock to the US dollar, widely regarded as the preeminent safe-haven currency, thereby eroding the diversification advantages of foreign currencies. The 12-month rolling correlation between currencies and equities in an MSCI EAFE portfolio has shown significant variability over time. Since 2001, it has ranged from -0.64 to 0.83, with positive correlations occurring about 59% of the time.
Portfolio insurance
On the other hand, hedging currency risk offers tangible benefits. By hedging to US dollars, investors effectively gain a form of natural portfolio insurance, reducing exposure to currency-driven volatility. Importantly, the cost of hedging is minimal. Annual trading costs typically amount to just a few basis points.
Additionally, over the past 20 years, US investors who hedged currency risk would have benefited from an average annual carry pickup of approximately 85 basis points, as interest rates have generally been higher in the US compared to other major economies. All things equal, currencies with higher interest rates generally attract increased demand. As US interest rates remain elevated, the demand for US Dollars is likely to persist in the foreseeable future.
Given these factors, the case for hedging currency risk is increasingly compelling, and US investors should reassess their approach to managing this critical risk. Whether adopting a passive or active hedging strategy, addressing currency risk is no longer an option to overlook. By effectively managing this risk, investors can enhance risk-adjusted returns and, more importantly, improve the financial outcomes for pension plan members.
Explore more currency insights
Four strategies to reduce liquidity management stress
Different approaches can help investors manage the liquidity challenges associated with their currency program.
Safe haven currency hedging
Why do US and Swiss pension funds use different currency risk strategies?
Spark
Our quarterly email featuring insights on markets, sectors and investing in what matters